Totally Rad Vibes
Get ready for some seriously awesome 90s nostalgia!
-
Crystal Candle Holder Tea Light Tealight Candle Holders Flower Vase Decor for Home Party Birthday Wedding Dinner Candlesticks
Regular price From $22.99 USDRegular price$15.65 USDSale price From $22.99 USDSold out -
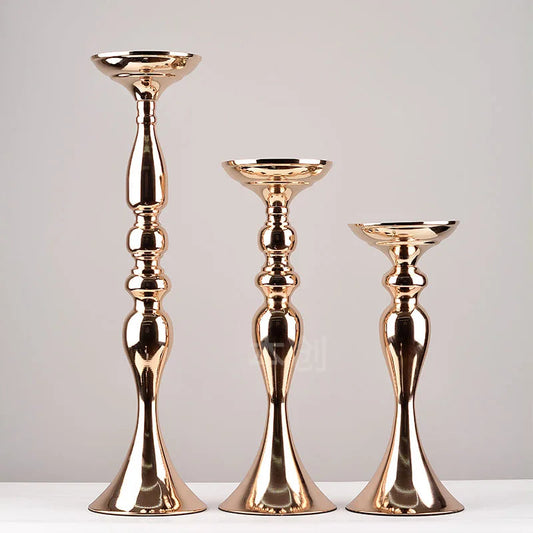
Metal Candle Holders Flowers Vase Candlestick Centerpieces Road Lead Candelabra Centerpieces Wedding porps Christmas decoration
Regular price From $19.99 USDRegular price$20.52 USDSale price From $19.99 USDSale -
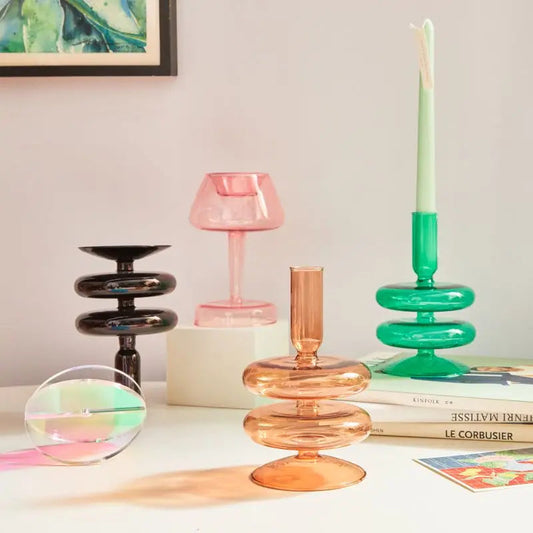
Glass Vases Clear Flower Vase Candle Holders Wedding Centerpieces Home Decoration Table Centerpieces Candlestick Holder
Regular price From $17.99 USDRegular price$17.30 USDSale price From $17.99 USDSold out -
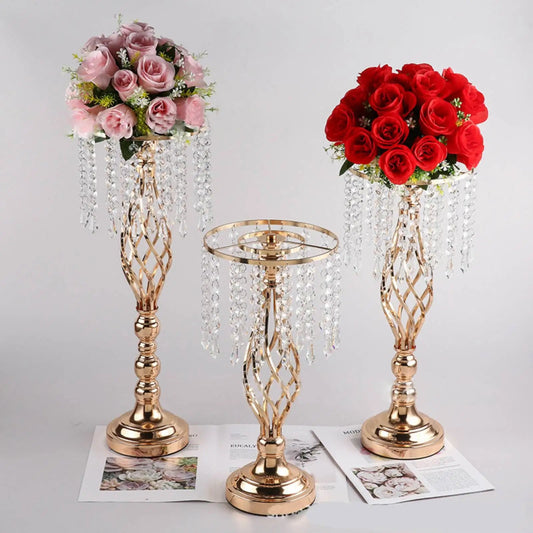
Table Candle Holder Decoration: Golden Iron Art Vase, Twisted Road Candlestick for Wedding Flowers, Wedding Props
Regular price From $23.99 USDRegular price$21.69 USDSale price From $23.99 USDSold out -
20 PCS Electronic Base Plastic Candlestick Holders Gold Decor Fashion Candleholder Wedding Centerpieces
Regular price $17.99 USDRegular price$16.73 USDSale price $17.99 USDSold out -
Candlestick Holder Glass Candle Holder for Candlestick Dinner Party Wedding Centerpieces Table Decoration Home Decor
Regular price From $16.99 USDRegular price$17.08 USDSale price From $16.99 USDSale -
Nordic Candle Holders Room Decor Candlesticks Holders Wedding Centerpieces Candles Holder Home Decor Candelabros Decorativos
Regular price From $21.99 USDRegular price$18.06 USDSale price From $21.99 USD -
Floriddle Taper Candle Holders Glass Candlesticks for Home Wedding Table Decoration Glass Vase Table Bookshelf Candles Stand
Regular price From $12.99 USDRegular price$12.49 USDSale price From $12.99 USDSold out -
1pcs sister gift, heart candlestick gift for sister, best sister birthday, thanksgiving, wedding gift (without candles)
Regular price $13.99 USDRegular price$15.24 USDSale price $13.99 USDSale -
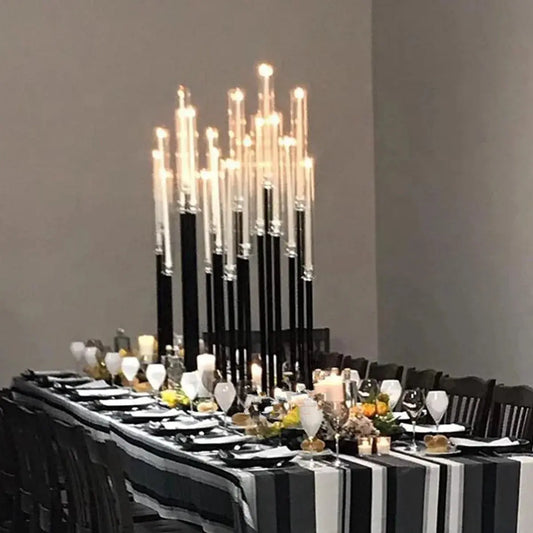
Wedding Table Centerpiece Flower Stand, Acrylic Candle Holder, Party Road Lead, DIY Decoration, 9 Heads Candlesticks, Black, 2 P
Regular price From $101.99 USDRegular price$101.22 USDSale price From $101.99 USD